Safety stock: 95% of what? Cycle service level vs fill rate
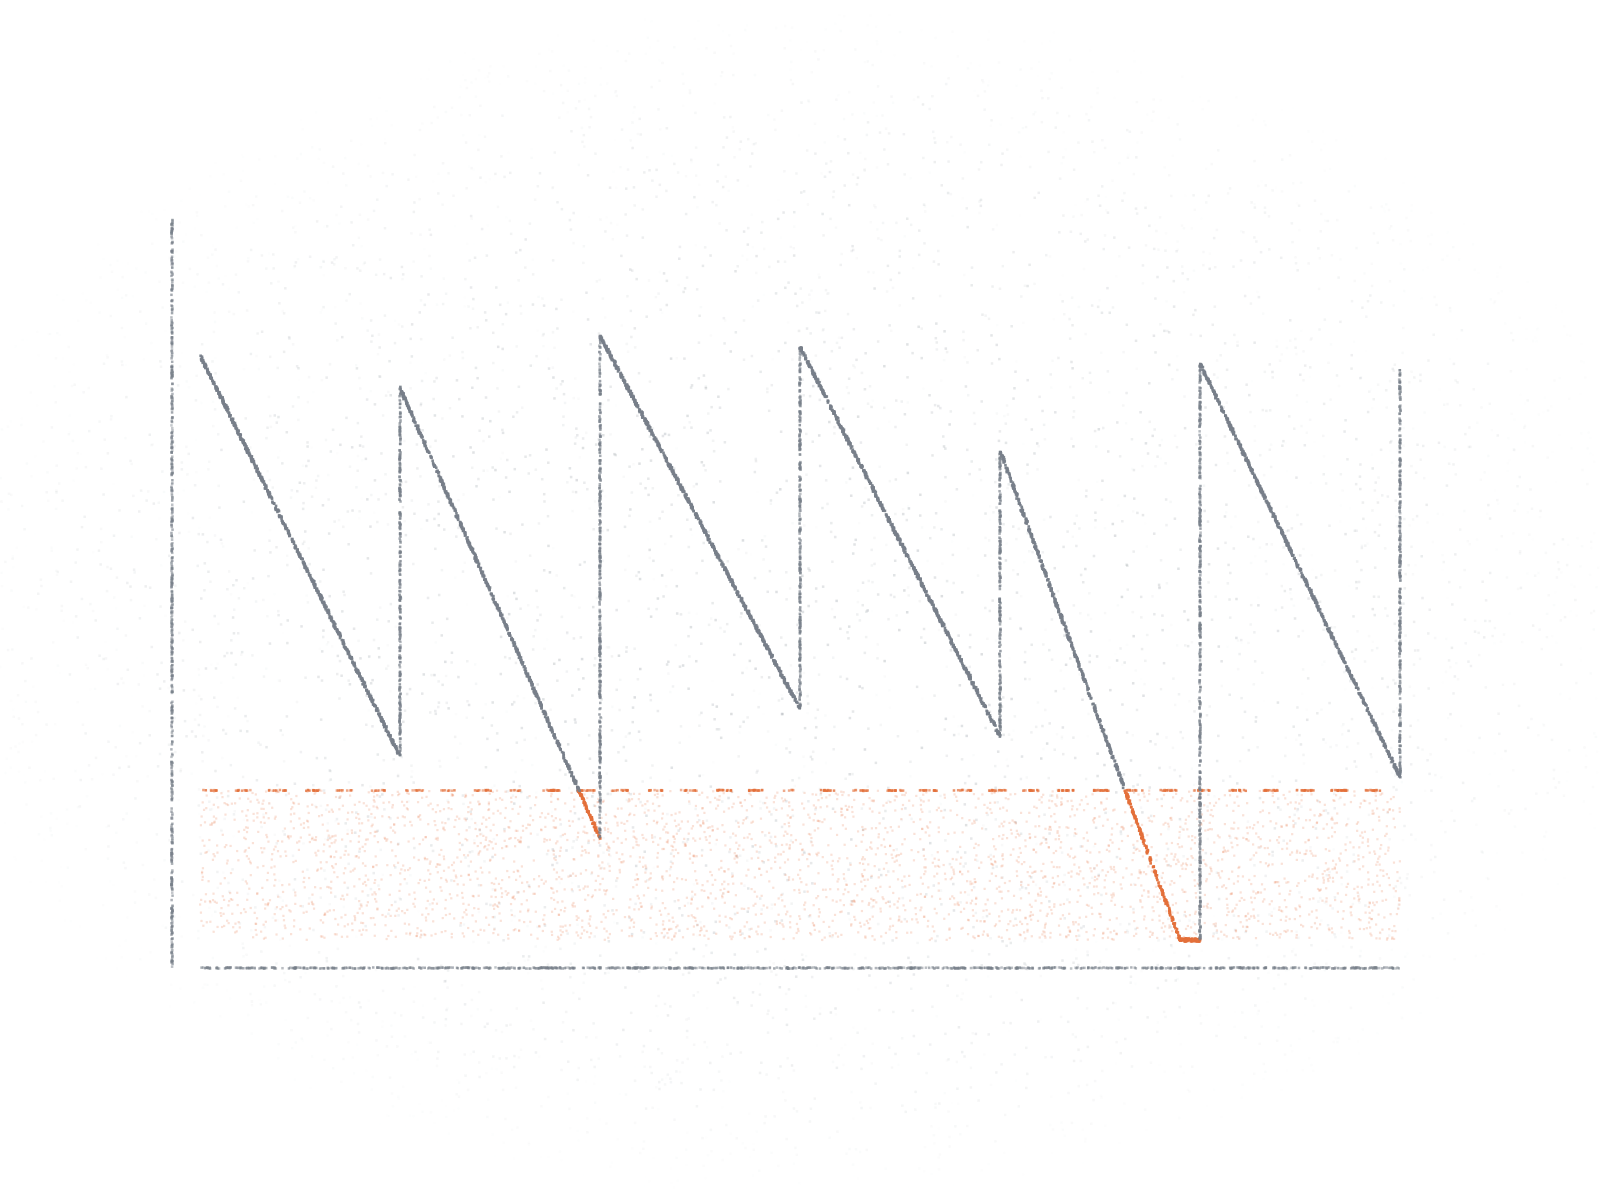
A target of “95%” for safety stock can mean two different things, and they need very different buffers. As a cycle service level, 95% of order cycles end without running out: in the example below that takes 436 units, and that stock ships 99.5% of demand straight from the shelf. As a fill rate, the share of units shipped from stock, even 98% needs only 277 units, and that buffer runs out in about one cycle in seven. Before setting the buffer, find out which of the two your target is. The numbers come from the Safety stock tool.
Two measures, one buffer
The example: 1,000 units a month with a monthly spread (standard deviation) of 250, a lead time of 21 days with a spread of 5 days, orders of 1,008 units (what the EOQ vs minimum order post arrives at), checked continuously.
| Safety stock | Reorder point | Cycles without a stockout | Demand shipped from stock |
|---|---|---|---|
| 436 units (set for 95% of cycles) | 1,126 | 95% | 99.5% |
| 277 units (set for a 98% fill rate) | 968 | 85.2% | 98% |
Both rows are correct. The first buffer is 158 units larger, worth €1,267 of stock at €8 a unit, and the only difference is which percentage you decided to hold to.
Why the numbers differ
The cycle service level counts order cycles. A cycle that runs out, by one unit or by two hundred, counts as a failure. The fill rate counts units: it is the share of demand you could ship from stock when it was asked for.
Stock can only run out at the end of a cycle, in the days before the next delivery lands. With orders of 1,008 there are about 11.9 cycles a year, each about a month of demand. A cycle that runs out usually does so late and briefly, so it misses a small share of that month’s demand. In the textbook model the expected shortage per cycle is σ × G(k): σ the spread of demand over the lead time (265 units here), k the safety stock divided by σ, and G the normal loss function. The fill rate is one minus that shortage divided by the order size.Caplice, MIT ESD.260 Logistics Systems, Lecture 11: item fill rate P2 = 1 − σ·G(k)/Q, and Lecture 12 for periodic review (Q becomes demand × review period). It is the standard backorder approximation; it slightly overstates shortages, so the true fill rate is a little higher (Guijarro, Cardós and Babiloni, 2012). The cycle service level is simply the chance that demand over the lead time stays below the reorder point: for 95%, k = 1.645.
The order size changes the fill rate
The order size is not in the cycle service level at all, but it is in the fill rate. Larger orders mean fewer cycles, so fewer moments at risk for each unit sold. For the same 98% fill rate:
| Units per order | Safety stock for a 98% fill rate | Fill rate of the 95%-of-cycles buffer (436 units) |
|---|---|---|
| 100 | 541 | 94.5% |
| 250 | 447 | 97.8% |
| 500 | 367 | 98.9% |
| 1,008 | 277 | 99.5% |
| 2,000 | 177 | 99.7% |
| 4,000 | 56 | 99.9% |
A common rule of thumb says the fill rate is always higher than the cycle service level for the same stock. That holds when orders are large compared with the spread of demand, as here. With orders of 100 units, three days of demand, it turns round: the 95%-of-cycles buffer fills only 94.5% of demand, and a 98% fill rate needs 541 units, more than the 95%-of-cycles buffer. So the size of order from the Order quantity tool feeds the safety stock directly when the target is a fill rate.
Safety stock for each target
The same item, with orders of 1,008:
| Target | As a cycle service level | As a fill rate |
|---|---|---|
| 90% | 339 | 10 |
| 95% | 436 | 139 |
| 98% | 544 | 277 |
| 99% | 616 | 366 |
| 99.5% | 682 | 446 |
Each extra point costs more than the one before: from 95% to 99% of cycles adds 181 units, from 99% to 99.5% another 66. A 90% fill rate needs almost no safety stock here (10 units), because orders of a month’s demand already cover most of it.
What the lead-time spread costs
The spread of demand over the lead time, σ = 265 units, has two parts: the demand varies from day to day (208 units over 21 days), and the lead time itself varies, each extra day of delay is a day of demand (32.9 units × 5 days = 164). They add as squares, so the lead time accounts for 39% of the variance.σ = √(L × σ_d² + d² × σ_L²), with L the lead time in days, d and σ_d the average and spread of daily demand, and σ_L the spread of the lead time. Chopra, Reinhardt and Dada (2004), who attribute it to Silver and Peterson.
At 95% of cycles, a supplier who always took exactly 21 days would need 342 units instead of 436: the ± 5 days cost 94 units of safety stock, worth €752. Halving the spread brings it to 367. If you only have the supplier’s quote, the tool reads it as a range: 14, usually 21, at most 35 days gives a mean of 23.3 days with a spread of 4.4, and 431 units of safety stock.
Which one to set
The two measure different harms, so the choice follows from what a stockout costs you:
- Fill rate when the cost is in units: a customer order shipped short, a backorder, a lost sale per unit. Customer scorecards that measure units shipped against units ordered are fill rates.
- Cycle service level when any stockout is the problem, however small: a production line that stops for one missing part, a shelf that must never be empty.
Where it breaks
- Demand over the lead time is taken as normal. That fits steady items with fair volume. For slow movers and items that sell only now and then it does not; the tool warns when demand over the lead time is below about 10 units, varies by more than half its mean, or (with pasted history) is intermittent.
- The fill-rate formula is the standard approximation. It slightly overstates shortages, so it errs towards more stock.
- Lead times are taken as independent of each other and of demand. A supplier who is late for everyone at once, in the same weeks that demand peaks, needs more than the formula gives.
- Checking stock on a schedule instead of continuously adds the review period to the time the buffer must cover: with a review every 14 days the 95% buffer rises to 517. See What is a reorder point?
Sources
- Caplice, C. (2006). ESD.260 Logistics Systems, Lectures 11 and 12: probabilistic demand, cycle service level and item fill rate. MIT OpenCourseWare.
- Chopra, S., Reinhardt, G., & Dada, M. (2004). The effect of lead time uncertainty on safety stocks. Decision Sciences, 35(1), 1–24.
- Guijarro, E., Cardós, M., & Babiloni, E. (2012). On the exact calculation of the fill rate in a periodic review inventory policy under discrete demand patterns. European Journal of Operational Research, 218(2), 442–447.
- Axsäter, S. (2013). When is it feasible to model low discrete demand by a normal distribution? OR Spectrum, 35, 153–162.
- Silver, E. A., Pyke, D. F., & Thomas, D. J. (2017). Inventory and Production Management in Supply Chains (4th ed.). CRC Press.
- All safety stocks: the Safety stock engine, with the example above.
Keep reading
More on inventory & replenishment
Topics: Inventory & replenishment