The most accurate forecast lost money
A bakery that bakes its most accurate forecast, 120 croissants a day, earns about €296 a day. Baking 147 earns about €309, 4.4% more, or roughly €4,700 a year on one product, even though 147 is the worse forecast: its average error is 22% larger. An unsold croissant costs €1; a missed sale costs €3. When the two mistakes cost different amounts, the best number to bake sits away from the most likely demand.
The setup
- Demand averages 120 croissants a day and varies by about ±40 (one standard deviation), roughly normally.A normal curve allows negative demand. At 120 ± 40 that happens on about 0.1% of days, too rare to change any number here.
- A croissant sells for €4 and costs €1 to bake.
- Whatever is left at closing is thrown away. A customer who finds the shelf empty buys nothing.
“Most accurate” here means the smallest average error between the forecast and real demand, the way forecasts are usually scored. For this demand that’s 120: half the days sell more, half sell less.
Why the less accurate number wins
Look at one extra croissant on top of the forecast. If it sells, it earns €3. If it doesn’t, it loses €1. So it’s worth baking as long as the chance of selling it is above 1 in 4. Put the other way: keep adding croissants until the chance that demand stays below the batch reaches 75%. That point, the 75% mark of demand, is 147 croissants.
- Profit per day
- €296
- same as forecast
- Thrown away
- 16
- same as forecast
- Sales missed
- 16
- same as forecast
- Forecast error
- 32
- same as forecast
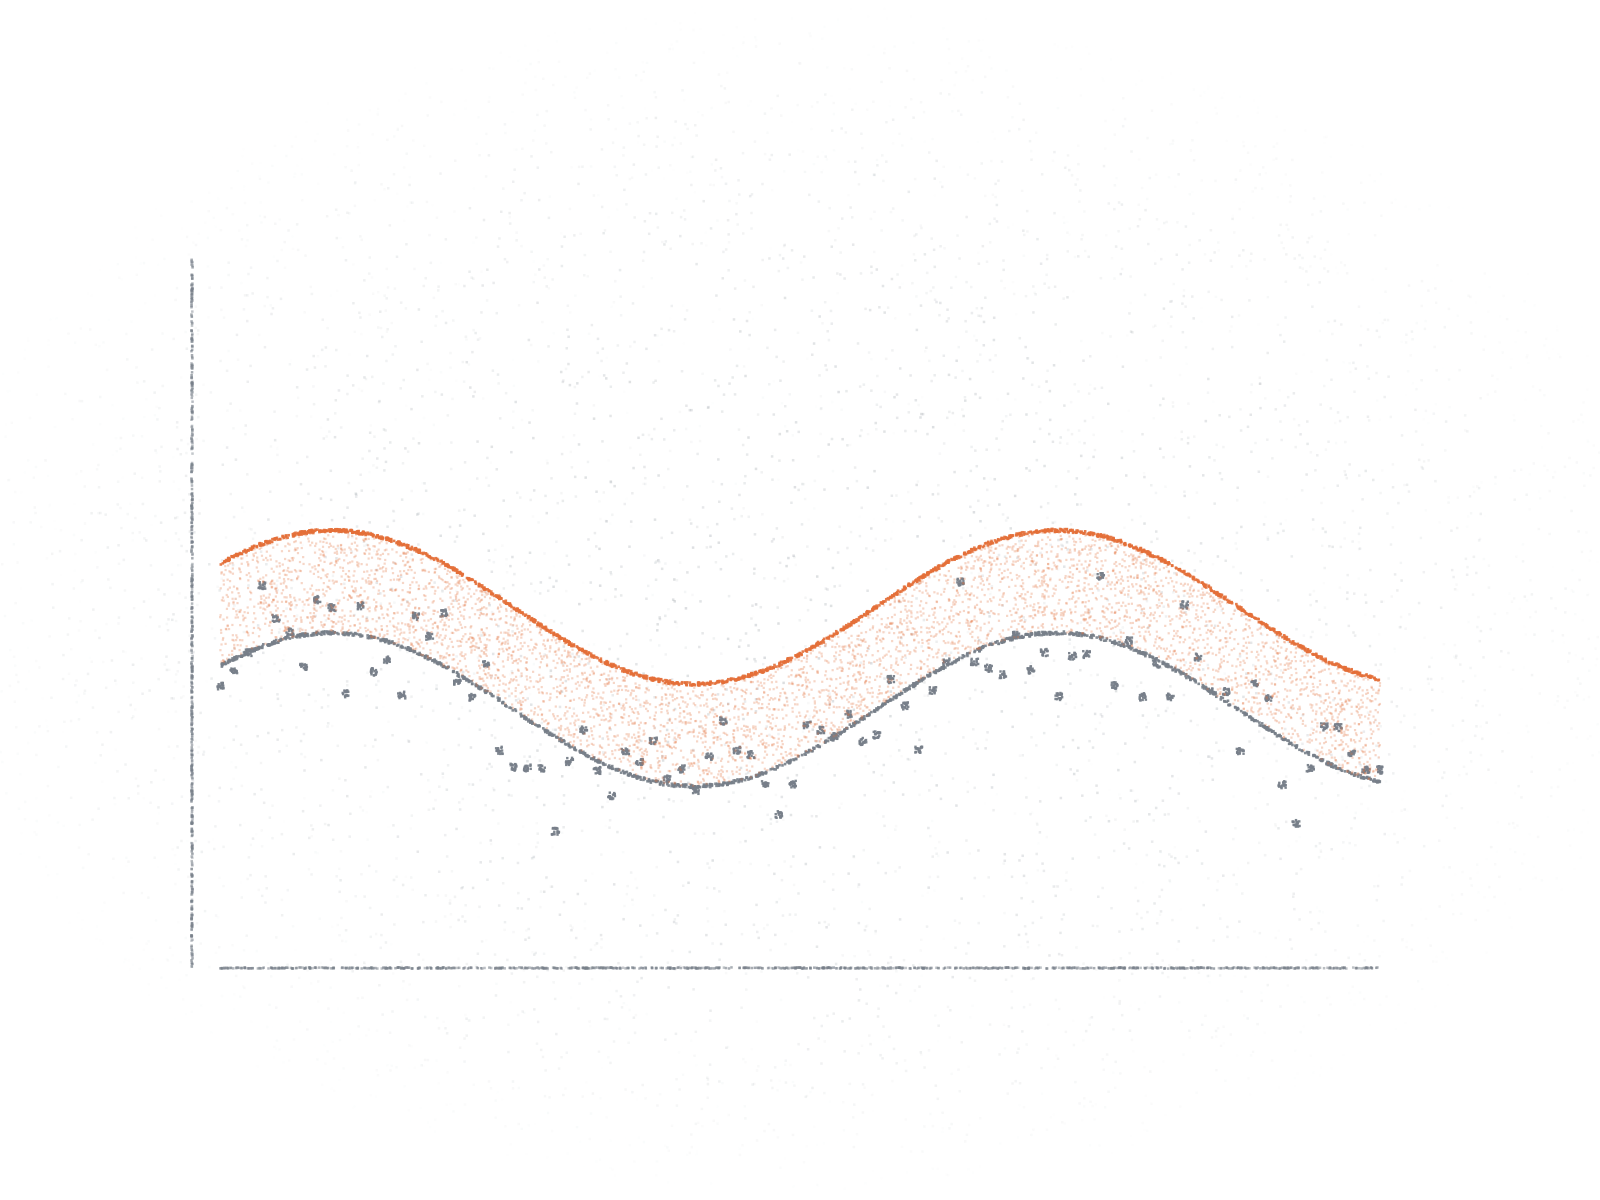
Each point on the blue lines is one batch size, averaged over many days of random demand. The dashed line marks the most accurate forecast, the solid line the most profitable batch. Drag across a chart or use the slider; switch the price to see the best batch move.
| Bake per day | 120 (most accurate) | 147 (most profitable) |
|---|---|---|
| Average profit | €296 | €309 |
| Croissants thrown away | 16 | 33 |
| Sales missed | 16 | 6 |
| Days the shelf runs empty | 50% | 25% |
| Average forecast error | 32 | 39 |
The profitable batch throws away twice as much bread and still earns more, because each missed sale costs three times what a wasted croissant does. This is the newsvendor problem, and the 75% is its critical ratio: margin divided by price.
An accuracy score treats a forecast that’s 20 too high the same as one that’s 20 too low. The till doesn’t. A forecast scored by absolute error is pulled toward the middle of demand; a forecast meant for a decision with lopsided costs should aim at a different point of demand, set by those costs.
It doesn’t always mean “bake more”
Same demand, but croissants now sell for €1.30 instead of €4. How many should the bakery bake?
Show the answer
Fewer. A missed sale now costs only €0.30 while a wasted croissant still costs €1. The critical ratio drops to 23%, and the best batch is 91, below the forecast.
The direction depends on the margin, not on the forecast. Wherever wasting costs more than missing, the best batch sits below the most likely demand; wherever missing costs more, above it.
Where this breaks
- Demand isn’t normal. Real daily sales are skewed and lumpy. The rule still holds, but the 75% point has to come from the bakery’s own sales history, not from a bell curve.
- Costs aren’t that simple. A customer who finds an empty shelf may not come back, which makes a missed sale more expensive. Leftovers that are sold off cheap or donated make waste cheaper. Both push the batch up.
- Sales hide demand. On a sold-out day the bakery sees how much it sold, not how much it could have sold. A forecast fitted to sales therefore underestimates demand, most of all for products that often run out.
- One product, one day. Shared ovens, shelf space and products that substitute for each other are left out here.
What to take from it
Sources
- Arrow, K. J., Harris, T., & Marschak, J. (1951). Optimal inventory policy. Econometrica, 19(3), 250–272.
- Gneiting, T. (2011). Quantiles as optimal point forecasts. International Journal of Forecasting, 27(2), 197–207.
- Cachon, G., & Terwiesch, C. Matching Supply with Demand: An Introduction to Operations Management. McGraw-Hill, chapter on the newsvendor model.